linux-Grafana_Loki+Promtail轻量级日志解决方案
linux-Grafana_Loki+Promtail轻量级日志解决方案
前篇
- 官方
- Grafana dashboards - https://grafana.com/grafana/dashboards/
loki 安装
- Install Loki - https://grafana.com/docs/loki/latest/setup/install/
- 日志收集系统PLG(Promtail+Loki+Grafana)介绍及部署 - https://www.cnblogs.com/xiangpeng/p/18127120
- 轻量级日志收集方案Loki - https://www.cnblogs.com/Sunzz/p/15190702.html
下载安装
官网下载: https://github.com/grafana/loki/releases, 这里下载的是 3.1.1 版本
1
2
3
4
5
$ unzip -o -d . loki-linux-amd64-3.1.1.zip
$ mkdir /usr/local/loki
$ mv loki-linux-amd64 /usr/local/loki
$ cd /usr/local/loki创建配置文件, 使用官方模板修改一下, 端口号修改一下为 8103
1
2
3
4
$ wget https://raw.githubusercontent.com/grafana/loki/v3.1.1/cmd/loki/loki-local-config.yaml // 3.1.1 为版本号
$ vim loki-local-config.yaml
http_listen_port: 8103启动服务
1
/usr/local/loki/loki-linux-amd64 -config.file=/usr/local/loki/loki-local-config.yaml
Grafana 配置 loki
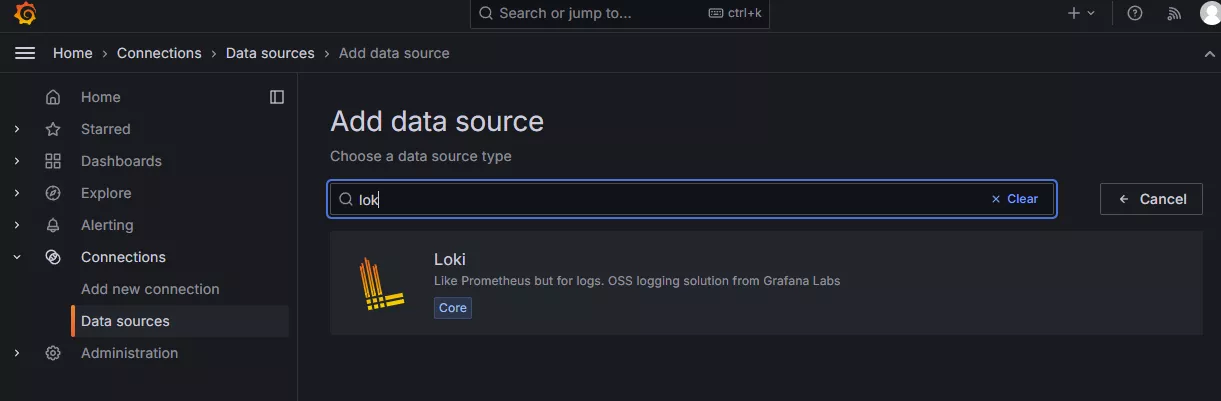
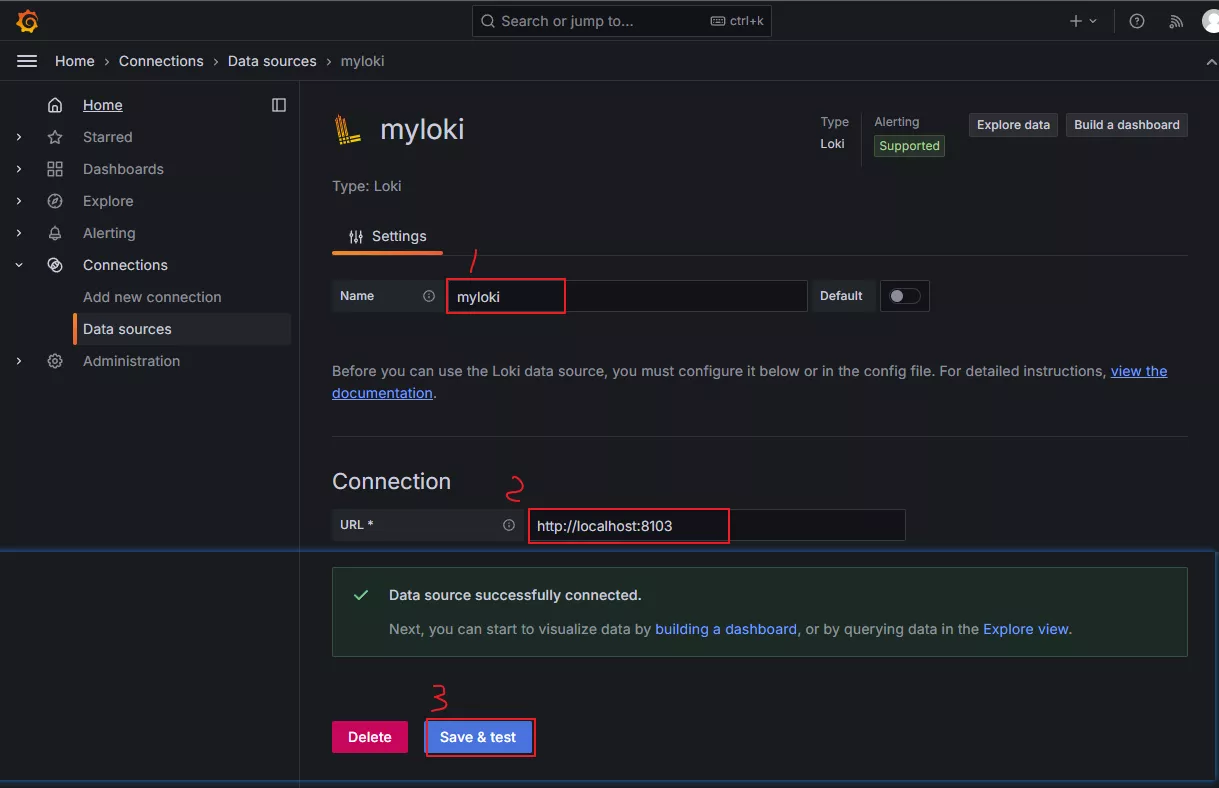
在数据源中搜索 loki, 添加并配置
配置正确的地址
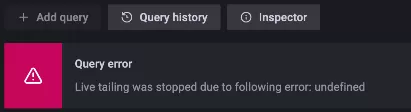
Live 模式需要添加 websocket 请求头键值对
默认不添加会报错
1
Query error Live tailing was stopped due to following error: undefined
需要添加到请求头的键值对
1
2
Connection: Upgrade
Upgrade: websocket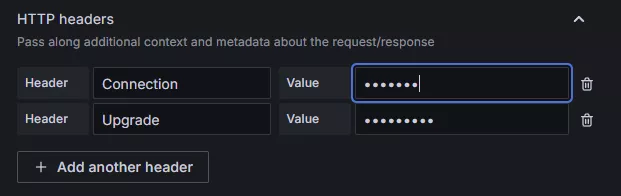
loki api
- Loki HTTP API - https://grafana.com/docs/loki/latest/reference/loki-http-api/
推送示例
1
2
3
4
5
6
7
8
9
10
11
12
13
14
15
16
17
18
19
20
21
nsTs = time.time_ns() # 纳秒级 时间精读
url = "http://aaa.bbb.com:8103/loki/api/v1/push"
data = {
"streams": [
{
"stream": {
"type": "eee", # 标签, 自定义键值对
"platform": "fff",
"version": "ddd",
},
"values": [ # 多条日志同时推送
[str(nsTs), "--- yx_log_world_0001"],
[str(nsTs + 1), "--- yx_log_world_0001"], # 第一个元素是 纳秒时间, 唯一
]
}
]
}
code, rspDct = utils.httpPost(url, data)
assert code == 204, f"--- fail, code: {code}" # 204 是正常上报的返回值
Promtail
下载 Promtail, https://github.com/grafana/loki/releases/download/v2.9.9/promtail-linux-amd64.zip, 这里下载 2.9.9 版本
1
2
$ wget https://github.com/grafana/loki/releases/download/v2.9.9/promtail-linux-amd64.zip
$ unzip -d . promtail-linux-amd64.zip查看系统的 GLIBC 版本是多少
1
2
$ ldd --version
ldd (Ubuntu GLIBC 2.31-0ubuntu9.9) 2.31- 2.31 使用 promtail 2.9.9 就好, 使用更高版本可能会出现这个问题 [启动报错找不到 libc.so](启动报错找不到 libc.so)
创建配置文件 myconf.yaml
参考官方 - https://grafana.com/docs/loki/latest/send-data/promtail/configuration/#example-static-config
1
2
3
4
5
6
7
8
9
10
11
12
13
14
15
16
17
18
19
20
server:
disable: true # 禁用 http grpc 服务
http_listen_port: 0
grpc_listen_port: 0
positions:
filename: /usr/local/promtail/positions.yaml # 指定记录已上传日志偏移量
clients:
- url: http://localhost:8103/loki/api/v1/push # loki 服务
scrape_configs:
- job_name: clash01 # 任务
static_configs:
- targets:
- localhost # localhost 通常只是作为占位符使用
labels:
job: clash02
type: access
__path__: /root/promtail/**.log最终会生成的标签
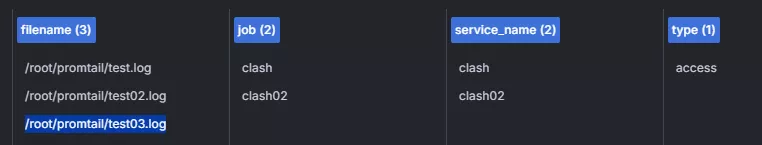
- labels 下的键值对都会作为标签
__path__: 生成的标签名为 filename, 值为文件的全路径- service_name: 看起来是取的是第一个标签
启动服务
1
$ /usr/local/promtail/promtail -config.file=/usr/local/promtail/myconf.yaml
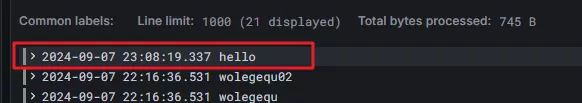
打个日志
1
$ echo hello >> /root/promtail/test03.log
此时会再偏移量记录文件 /usr/local/promtail/positions.yaml 记录字节偏移量
1
2
positions:
/root/promtail/test03.log: "6"done
在 grafana 中就可以看到日志了
配置说明
官方 - https://grafana.com/docs/loki/latest/send-data/promtail/configuration/
示例
1
2
3
4
5
6
7
8
9
10
11
12
13
14
15
16
17
18
19
20
21
22
23
24
25
26
27
28
29
30
31
32
33
34
35
36
37
38
39
40
41
42
43
44
45
46
47
48
49
50
51
52
53
54
55
56
57
58
59
60
61
62
63
server:
log_level: debug # 日志级别 [debug, info, warn, error]
disable: true # 禁用 http grpc 服务
http_listen_port: 0
grpc_listen_port: 0
positions:
filename: /var/lib/promtail/positions.yaml # 偏移量记录文件
clients:
- url: http://localhost:3100/loki/api/v1/push # loki 服务
headers: # 带上请求头做校验
Authorization: aaabbbccc
external_labels: # 全局 标签, 所有任务都会带上
myext01: hello
myext02: world
# Default backoff schedule:
# 0.5s, 1s, 2s, 4s, 8s, 16s, 32s, 64s, 128s, 256s(4.267m)
backoff_config: # 失败重传
min_period: 500ms
max_period: 5m
max_retries: 10
scrape_configs:
# 任务 1
- job_name: system
decompression:
enabled: true
initial_delay: 10s
format: gz
static_configs:
- targets:
- localhost
labels:
job: varlogs
host: server1
app: myapp
__path__: /var/log/**.gz
# 任务 2
- job_name: job02
static_configs:
# 目标 1
- targets:
- localhost
labels: # 多个标签
mytype: type01 # 标签 1
myname: name01 # 标签 2
__path__:
- /var/log/syslog01 # 路径 1
- /var/log/syslog02 # 路径 2
- /var/log/auth.log # 正则匹配
# 目标 2
- targets:
- localhost
labels:
mytype: type02
myname: name02
__path__: /var/log/**.gz
启动报错找不到 libc.so
报错:
1
./promtail-linux-amd64: /lib/x86_64-linux-gnu/libc.so.6: version GLIBC_2.32' not found (required by ./promtail-linux-amd64)
原因是系统的 libc 与 promtail 不匹配, promtail 要求的版本是 GLIBC_2.32, 查看系统 libc 的版本时 2.31
1
2
$ ldd --version
ldd (Ubuntu GLIBC 2.31-0ubuntu9.9) 2.31解决办法: 有两个
- 建议: 使用低版本 promtail 2.9.9 就支持 GLIBC_2.31
- 不建议: 升级系统的 GLIBC, 可能会造成生成环境出现问题
指定偏移量
有种场景就是:在 promtail 中新增一个日志文件时, 日志文件已有的日志都不需要上报, 可以手动指定偏移量, 假设已有 100 行日志, 100 行都不需要上报
获取 100 行的字节偏移量
1
2
$ head -n 100 ./test03.log | wc -c
4000在位置文件 /var/lib/promtail/positions.yaml 中指定文件和偏移量 4000
1
2
3
4
$ vim /var/lib/promtail/positions.yaml
positions:
/root/promtail/test03.log: "4000"
踩坑
大坑 上报失败也会记录偏移量
- 如果对上报丢失可容忍的话, 这个可以忽略, 比如只是用作日志查询
重试机制不生效
配置了 backoff_config 但是不生效
1
2
3
4
backoff_config: # 失败重传
min_period: 500ms
max_period: 5m
max_retries: 10promtail 只会对 429, 500 还有网络链接 错误的 http 状态码 进行重试机制
1
2
3
4
// Only retry 429s, 500s and connection-level errors.
if status > 0 && !batchIsRateLimited(status) && status/100 != 5 {
break
}- 所以先看看返回的状态码是否在这个范围内