go-goroutine泄漏检测
go-goroutine泄漏检测
前篇
泄露
关于Go的内存泄露有这么一句话不知道你听过没有:
10次内存泄露,有9次是goroutine泄露。
- 实战Go内存泄露 - https://segmentfault.com/a/1190000019222661
- 如何防止 goroutine 泄露 (好文) - https://juejin.im/post/5d2f66a251882553086ab819
- goroutine泄露:原理、场景、检测和防范 (好文) - https://segmentfault.com/a/1190000019644257
goroutine 泄露怎么导致内存泄露
每个goroutine占用2KB内存,泄露1百万goroutine至少泄露2KB * 1000000 = 2GB内存,为什么说至少呢?
goroutine执行过程中还存在一些变量,如果这些变量指向堆内存中的内存,GC会认为这些内存仍在使用,不会对其进行回收,这些内存谁都无法使用,造成了内存泄露。
所以goroutine泄露有2种方式造成内存泄露:
- goroutine本身的栈所占用的空间造成内存泄露。
- goroutine中的变量所占用的堆内存导致堆内存泄露,这一部分是能通过heap profile体现出来的。
goroutine 泄露的本质
如果你启动了一个goroutine,但并没有按照预期的一样退出,直到程序结束,此goroutine才结束,这种情况就是 goroutine 泄露。当 goroutine 泄露发生时,该 goroutine 的栈一直被占用而不能释放,goroutine 里的函数在堆上申请的空间也不能被垃圾回收器回收。这样,在程序运行期间,内存占用持续升高,可用内存越来也少,最终将导致系统崩溃。
大多数情况下,引起goroutine泄露的原因有两类:
- channel阻塞
- goroutine陷入死循环。
goroutine 泄露的发现和定位
[记一次 go 泄露检测](#记一次 go 泄露检测)
利用好go pprof获取goroutine profile文件,然后利用3个命令top、traces、list定位内存泄露的原因。
怎么用 heap 发现内存问题
使用pprof的heap能够获取程序运行时的内存信息,在程序平稳运行的情况下,每个一段时间使用heap获取内存的profile,然后使用base能够对比两个profile文件的差别,就像diff命令一样显示出增加和减少的变化
goroutine泄露的场景
泄露的场景不仅限于以下两类,但因channel相关的泄露是最多的。
- channel的读或者写:
- 无缓冲channel的阻塞通常是写操作因为没有读而阻塞
- 有缓冲的channel因为缓冲区满了,写操作阻塞
- 期待从channel读数据,结果没有goroutine写
- select操作,select里也是channel操作,如果所有case上的操作阻塞,goroutine也无法继续执行。
编码 goroutine 泄露的建议
为避免goroutine泄露造成内存泄露,启动goroutine前要思考清楚:
- goroutine如何退出?
- 是否会有阻塞造成无法退出?如果有,那么这个路径是否会创建大量的goroutine?
- 充分利用好 context 这个库
实测
启动 pprof 网页查看
profiler_test.go
1
2
3
4
5
6
7
8
9
10
11
12
13
14
15
16
package profiler_test
import (
"fmt"
"net/http"
_ "net/http/pprof" // 打开 profiler, 里面有 init 会初始化相关代码
"testing"
)
func Test_openPprof(t *testing.T) {
// 开启pprof,监听请求
ip := "0.0.0.0:6060"
if err := http.ListenAndServe(ip, nil); err != nil {
fmt.Printf("start pprof failed on %s\n", ip)
}
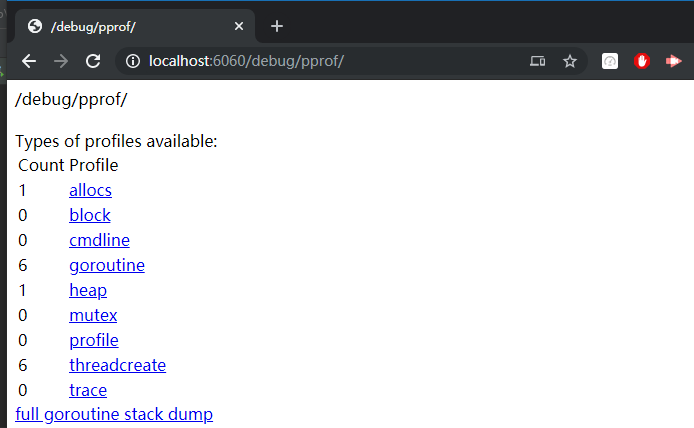
}打开网页: http://localhost:6060/debug/pprof/
下载当前快照到本地文件, 如: heap, 命令:
go tool pprof [addr]/debug/pprof/heap1
2
3
4
5
6
7
8
9
10
11
12
13
14$ go tool pprof http://localhost:6060/debug/pprof/heap
Fetching profile over HTTP from http://localhost:6060/debug/pprof/heap
Saved profile in C:\Users\wolegequ\pprof\pprof.alloc_objects.alloc_space.inuse_objects.inuse_space.001.pb.gz
Type: inuse_space
Time: Dec 10, 2019 at 11:10am (CST)
Entering interactive mode (type "help" for commands, "o" for options)
(pprof) top
Showing nodes accounting for 69.87MB, 100% of 69.87MB total
flat flat% sum% cum cum%
69.87MB 100% 100% 69.87MB 100% GoLab/test_profiler_test.Test_leak01
0 0% 100% 69.87MB 100% testing.tRunner
(pprof)保存到本地文件:
C:\Users\wolegequ\pprof\pprof.alloc_objects.alloc_space.inuse_objects.inuse_space.001.pb.gz本地查看信息, 命令:
go tool pprof [file]1
2
3
4
5
6
7
8
9
10
11
12C:\Users\wolegequ\pprof
$ go tool pprof pprof.alloc_objects.alloc_space.inuse_objects.inuse_space.001.pb.gz
Type: inuse_space
Time: Dec 10, 2019 at 11:10am (CST)
Entering interactive mode (type "help" for commands, "o" for options)
(pprof) top
Showing nodes accounting for 69.87MB, 100% of 69.87MB total
flat flat% sum% cum cum%
69.87MB 100% 100% 69.87MB 100% GoLab/test_profiler_test.Test_leak01
0 0% 100% 69.87MB 100% testing.tRunner
(pprof)
打快照
打 goroutine 快照为例
命令: go tool pprof http://localhost:6060/debug/pprof/goroutine
两个快照对比
这种方式可以很容易检测出来, 会列出信息的差值
1 | $ go tool pprof -base pprof.goroutine.001.pb.gz pprof.goroutine.002.pb.gz |
记一次 goroutine 泄露检测
对比快照 方式
主要是测试 server, rpc 时的 client 连上 100 个tcp, 然后发发消息, 再断掉连接, 对比两个快照是否有 goroutine 差值
打快照.
- 启动 server, 打快照: pprof.goroutine.001.pb.gz
- 并发一百个 tcp client 连接 server, 打快照: pprof.goroutine.002.pb.gz
- 断掉所有 tcp client, 打快照: pprof.goroutine.003.pb.gz
对比快照. 一般使用
top,traces,list xxx这三个命令就可以追踪带哪些 goroutine 泄露了对比 1 和 2
1
2
3
4
5
6
7
8
9
10
11
12
13
14
15
16
17
18
19
20
21
22
23
24
25
26
27
28
29
30
31
32
33
34
35
36
37
38
39
40
41
42
43
44
45
46
47
48
49
50
51
52
53
54
55
56
57
58$ go tool pprof -base pprof.goroutine.001.pb.gz pprof.goroutine.002.pb.gz
Type: goroutine
Time: Dec 10, 2019 at 12:33pm (CST)
Entering interactive mode (type "help" for commands, "o" for options)
(pprof) top // 1. 列出差值
Showing nodes accounting for 300, 100% of 300 total
Showing top 10 nodes out of 14
flat flat% sum% cum cum%
300 100% 100% 300 100% runtime.gopark // 发现 2 比 1 多了 300 goroutine
0 0% 100% 100 33.33% internal/poll.(*FD).Read
0 0% 100% 100 33.33% internal/poll.(*ioSrv).ExecIO
0 0% 100% 100 33.33% internal/poll.(*pollDesc).wait
0 0% 100% 100 33.33% internal/poll.runtime_pollWait
0 0% 100% 100 33.33% mars/module/rpc.(*Agent).recvLoop.func1
0 0% 100% 100 33.33% mars/module/rpc.(*Agent).run
0 0% 100% 100 33.33% mars/module/rpc.(*Agent).sendLoop
0 0% 100% 100 33.33% mars/module/rpc.(*Agent).timeoutCheck.func1
0 0% 100% 100 33.33% mars/module/rpc.(*server).run.func1.2
(pprof) traces // 2. 追踪协程的
Type: goroutine
Time: Dec 10, 2019 at 12:33pm (CST)
-----------+-------------------------------------------------------
100 runtime.gopark
runtime.netpollblock
internal/poll.runtime_pollWait
internal/poll.(*pollDesc).wait
internal/poll.(*ioSrv).ExecIO
internal/poll.(*FD).Read
net.(*netFD).Read
net.(*conn).Read
mars/module/rpc.(*Agent).recvLoop.func1 // rpc.(*Agent).recvLoop 方法里面有 100 个匿名协程
-----------+-------------------------------------------------------
100 runtime.gopark
runtime.selectgo
mars/module/rpc.(*Agent).sendLoop
mars/module/rpc.(*Agent).run
mars/module/rpc.(*server).run.func1.2 // rpc.(*server).run 里有 100 个匿名协程
-----------+-------------------------------------------------------
100 runtime.gopark
runtime.selectgo
mars/module/rpc.(*Agent).timeoutCheck.func1 // rpc.(*Agent).timeoutCheck 有 100 个匿名协程
-----------+-------------------------------------------------------
(pprof) list run.func1.2 // 3. 列出 run.func1.2 附近的代码
Total: 300
ROUTINE ======================== mars/module/rpc.(*server).run.func1.2 in F:\a_link_workspace\go\GoWinEnv_Mars\src\mars\module\rpc\rpc_server.go
0 100 (flat, cum) 33.33% of Total
. . 79: rpIns.delAgent(agent)
. . 80: s.connWg.Done()
. . 81: }()
. . 82:
. . 83: agent.init()
. 100 84: agent.run()
. . 85: }()
. . 86: }
. . 87: }
. . 88: }()
. . 89: return nil
(pprof)- 对比结果符合预期, 因为每个 tcp 上来会启动 3 个协程 ( agent run-发消息, 收消息 , 消息超时定时器)
对比 1 和 3
1
2
3
4
5
6
7
8
9
10
11
12
13
14
15
16
17
18
19
20
21
22
23
24
25
26
27
28
29
30
31
32
33$ go tool pprof -base pprof.goroutine.001.pb.gz pprof.goroutine.003.pb.gz
Type: goroutine
Time: Dec 10, 2019 at 12:33pm (CST)
Entering interactive mode (type "help" for commands, "o" for options)
(pprof) top
Showing nodes accounting for 0, 0% of 2 total
flat flat% sum% cum cum%
-1 50.00% 50.00% 0 0% net/http.(*connReader).backgroundRead
1 50.00% 0% 1 50.00% runtime.gopark
0 0% 0% 1 50.00% internal/poll.(*FD).Read
0 0% 0% 1 50.00% internal/poll.(*ioSrv).ExecIO
0 0% 0% 1 50.00% internal/poll.(*pollDesc).wait
0 0% 0% 1 50.00% internal/poll.runtime_pollWait
0 0% 0% 1 50.00% net.(*conn).Read
0 0% 0% 1 50.00% net.(*netFD).Read
0 0% 0% 1 50.00% runtime.netpollblock
(pprof) traces
Type: goroutine
Time: Dec 10, 2019 at 12:33pm (CST)
-----------+-------------------------------------------------------
1 runtime.gopark
runtime.netpollblock
internal/poll.runtime_pollWait
internal/poll.(*pollDesc).wait
internal/poll.(*ioSrv).ExecIO
internal/poll.(*FD).Read
net.(*netFD).Read
net.(*conn).Read
net/http.(*connReader).backgroundRead
-----------+-------------------------------------------------------
-1 net/http.(*connReader).backgroundRead
-----------+-------------------------------------------------------
(pprof)- 符合预期, 所有的 agent 相关的 协程 都释放了
网页查看 方式
打开网页地址: http://localhost:6060/debug/pprof/goroutine?debug=1
启动 server, 刷网页
1
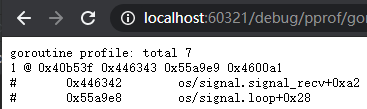
goroutine profile: total 7
并发一百个 tcp client 连接 server, 刷网页
1
goroutine profile: total 307
断掉所有 tcp client, 刷网页
1
goroutine profile: total 7
- 符合预期, 降回原来的 7 个协程
记一次 goroutine 定位及解决
解决灵感来源于:
- Go 通道(chan)关闭和后续读取操作 - https://blog.csdn.net/Tovids/article/details/77867284
- 一次由于Channel buffer size导致Go内存泄漏的分析 - https://blog.lcy.im/2018/03/30/%E4%B8%80%E6%AC%A1%E7%94%B1%E4%BA%8Echannel-%E5%AF%BC%E8%87%B4go%E5%86%85%E5%AD%98%E6%B3%84%E6%BC%8F%E7%9A%84%E5%88%86%E6%9E%90/
在写 rpc 时, 要求连上来的第一个协议是自定义 握手协议, 如果规定时间内没有握手 或者 握手失败, 就判定为非法连接, 然后断掉连接. 代码大概如下
1
2
3
4
5
6
7
8
9
10
11
12
13
14
15
16
17
18
19
20
21
22
23
func Test_gorLeak(t *testing.T) {
pprof.StartPprof(":60321") // 开启 pprof
chValid := make(chan bool)
go func() {
defer fmt.Println("--- handshake defer")
time.Sleep(time.Second * 4) // 模拟 3s 超时后, 关掉 conn 后, conn.Read(buff) 返回 error 的情况
chValid <- false
}()
tmoCtx, _ := context.WithTimeout(context.TODO(), time.Second*3) // 超时时间为 3s
var isValid bool
select {
case isValid = <-chValid:
case <-tmoCtx.Done():
fmt.Printf("--- tmoCtx isValid:%v\n", isValid)
}
fmt.Printf("--- ret:%+v\n", isValid)
common.WaitSignal()
fmt.Printf("--- exit\n")运行结果
1
2
--- tmoCtx isValid:false
--- ret:false--- handshake defer这个 log 一直没有打出来, 因为这个协程一直没有退出打开 pprof 网页查看: http://localhost:60321/debug/pprof/goroutine?debug=1
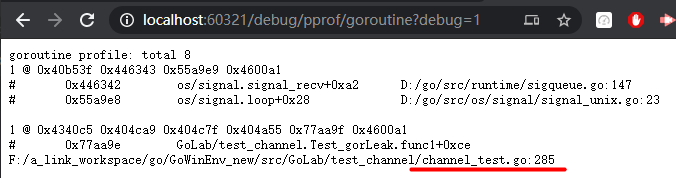
也就是
chValid <- false这一行一直阻塞着, 因为一直没有地方消费<-chValid,select因为超时走了<-tmoCtx.Done()
解决.
1
2
3
chValid := make(chan bool)
// 修改为
chValid := make(chan bool, 1) // 指定 size 为 1运行结果
1
2
3
--- tmoCtx isValid:false
--- ret:false
--- handshake defer // 看到这个日志说明 协程 退出了在看看网页, 没有泄露了.
原因是因为没有
select去消费 chan 时, 在往里面丢数据 (chValid <- false) 时就会阻塞掉, 如果分配了 1 个大小, 那么久可以在没有select消费时, 容纳 1 条数据, 如果丢两条数据, 那么将又会阻塞如此类推. 分配 n 的大小, 就容许 n 条数据不被消费
可视化GMP编程
- Golang的协程调度器原理及GMP设计思想? - https://www.toutiao.com/i6797580089891488259/
有2种方式可以查看一个程序的GMP的数据。
方式1:go tool trace
trace记录了运行时的信息,能提供可视化的Web页面。
简单测试代码:main函数创建trace,trace会运行在单独的goroutine中,然后main打印”Hello World”退出。
1
2
3
4
5
6
7
8
9
10
11
12
13
14
15
16
17
18
19
20
21
22
23
24
25
26
27
28
package main
import (
"os"
"fmt"
"runtime/trace"
)
func main() {
//创建trace文件
f, err := os.Create("trace.out")
if err != nil {
panic(err)
}
defer f.Close()
//启动trace goroutine
err = trace.Start(f)
if err != nil {
panic(err)
}
defer trace.Stop()
//main
fmt.Println("Hello World")
}运行程序
1
2
$ go run trace.go
Hello World会得到一个 trace.out 文件
然后我们可以用一个工具打开,来分析这个文件。
1
2
3
4
$ go tool trace trace.out
2020/02/23 10:44:11 Parsing trace...
2020/02/23 10:44:11 Splitting trace...
2020/02/23 10:44:11 Opening browser. Trace viewer is listening on http://127.0.0.1:33479我们可以通过浏览器打开 http://127.0.0.1:33479 网址,点击 view trace 能够看见可视化的调度流程。
方式2:Debug trace
测试代码
1
2
3
4
5
6
7
8
9
10
11
12
13
package main
import (
"fmt"
"time"
)
func main() {
for i := 0; i < 5; i++ {
time.Sleep(time.Second)
fmt.Println("Hello World")
}
}编译
1
$ go build trace2.go
通过Debug方式运行
1
2
3
4
5
6
7
8
9
10
11
$ GODEBUG=schedtrace=1000 ./trace2
SCHED 0ms: gomaxprocs=2 idleprocs=0 threads=4 spinningthreads=1 idlethreads=1 runqueue=0 [0 0]
Hello World
SCHED 1003ms: gomaxprocs=2 idleprocs=2 threads=4 spinningthreads=0 idlethreads=2 runqueue=0 [0 0]
Hello World
SCHED 2014ms: gomaxprocs=2 idleprocs=2 threads=4 spinningthreads=0 idlethreads=2 runqueue=0 [0 0]
Hello World
SCHED 3015ms: gomaxprocs=2 idleprocs=2 threads=4 spinningthreads=0 idlethreads=2 runqueue=0 [0 0]
Hello World
SCHED 4023ms: gomaxprocs=2 idleprocs=2 threads=4 spinningthreads=0 idlethreads=2 runqueue=0 [0 0]
Hello World